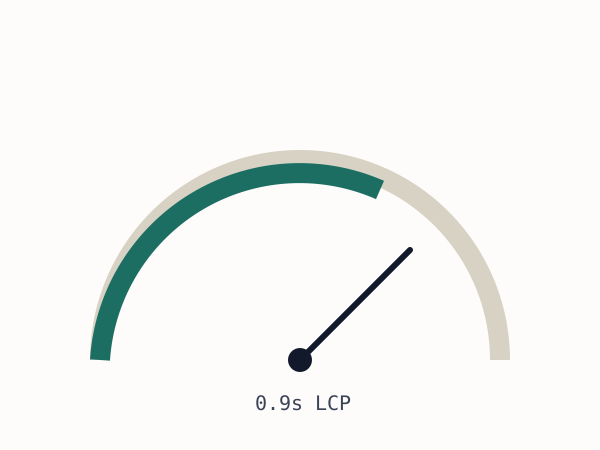
Performance work used to be something we did if there was budget left over. That's changed this year, partly because Google has announced Core Web Vitals as a set of concrete, measurable signals - loading, interactivity, and visual stability - that will factor into search ranking. Clients who never cared about "performance" as an abstraction suddenly care a great deal about a number in Search Console.
Where the time actually goes
Before optimising anything, measure it. Chrome DevTools' Lighthouse panel and the Network tab together usually make the biggest offender obvious within minutes - and on the majority of the audits we run, that offender is unoptimised images.
<!-- Serve the right size for the viewport, not one giant file for everyone -->
<img
  src="hero-800.jpg"
  srcset="hero-400.jpg 400w, hero-800.jpg 800w, hero-1600.jpg 1600w"
  sizes="(max-width: 600px) 400px, 800px"
  alt="Person working at a desk"
  loading="lazy">
The native loading="lazy" attribute, now supported in Chrome and Edge, defers offscreen images until they're about to scroll into view - a meaningful win with zero JavaScript required.

Ship less JavaScript
The second most common issue is a JavaScript bundle doing far more work than the page actually needs on first load. Code-splitting - loading only what a given route needs, and fetching the rest on demand - is the single biggest lever here:
// Only loaded when the route is actually visited
const AdminPanel = React.lazy(() => import('./AdminPanel'));
Critical CSS and font loading
Render-blocking CSS delays the first paint. Inlining the small amount of CSS needed for above-the-fold content, and loading the rest asynchronously, gets pixels on screen sooner:
<link rel="preload" href="fonts/body.woff2" as="font" type="font/woff2" crossorigin>
font-display: swap in the @font-face rule is worth adding almost everywhere too - it shows fallback text immediately instead of leaving the page blank while a custom font downloads.
Caching and compression, the boring wins
# nginx
gzip on;
location ~* \.(css|js)$ {
  expires 1y;
  add_header Cache-Control "public, immutable";
}
Neither line is glamorous. Both are near-guaranteed wins on any project that hasn't already configured them, and they take minutes to add.
Performance isn't one big fix. It's a dozen small, boring ones, most of them under an hour each.
Measure before optimizing - always
// Lighthouse, WebPageTest, or Chrome DevTools Performance tab
// Find the actual bottleneck before changing anything
Optimizing a resource that isn't actually the bottleneck is wasted effort dressed up as productivity - a gorgeously optimized hero image does nothing for a page whose real problem is a third-party analytics script blocking the main thread for two seconds. Profile first, then fix the thing the profile actually points at.
The fixes that consistently matter most
Across the sites we've optimized, three changes account for the majority of real-world improvement: compressing and correctly sizing images, deferring or removing render-blocking JavaScript, and self-hosting fonts with font-display: swap instead of blocking render on a third-party font request. Fancy micro-optimizations rarely move the needle as much as fixing those three unglamorous basics properly.